Render Heatmaps
Are pictures worth 1000 statistics?
Debugging rendering issues can be particularly problematic. Many times, the efficiency of standard debugging procedures (e.g. printing intermediate values, or using a debugger) fall apart at the sheer volume of data they will produce when you are calling them millions of time per frame.
Often, intermediate values can be dumped out via an AOV (i.e. to another image), and inspected as an image. For example, if you were interested in how long various parts of the image are taking to render vs. the others, you could create a heatmap such as:
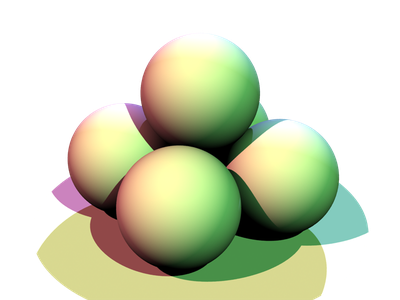
In this particular example, however, there are a few drawbacks:
- RSL does not have any timing functions;
- every shader would need to be modified in order to collect these stats; and
- you generally only receive information from the front-most surface.
I set out to resolve those issues.
RSL Timing Functions
First, note that this part isn't actually required for timing the full shading pipeline in PRMan, as there is a __CPUtime AOV built in. However, I am interested in wrapping each part of the shading pipeline individually, and that AOV does not appear to separate them out.
That being said, this was by far the easiest part of the project. By following the PRMan docs, I created a single time RSL shadeop (see the source).
All you need to do in order to use your custom shadeops is add a plugin directive at the top-level of your shader:
plugin "time_shadeops"; // Looks for "time_shadeops.so" on the shader path.
and then you can freely use any of the shadeops defined therein:
float startTime = time();

// Do something that takes a while.

float elapsedTime = time() - startTime;
Wrapping Shader Calls
I wanted to be able to use existing shaders without modification, and still collect some stats on their execution. I decided to create a stats-collecting wrapper around the original shader, which would proxy calls to original shader and output the stats into an AOV.
The general idea is to use a Ri Filter to turn Surface (and other shader) calls into a Shader for use as a co-shader, and then drop our wrapper in place. This roughly turns the following RIB:
Surface "matte" "float Kd" [0.8]
into:
Shader "matte" "wrapped_matte_1" "float Kd" [0.8]
Surface "stats_wrapper" "string wrapped_name" "wrapped_matte_1"
The tricky part is that the set of functions that a shader exposes to the renderer actually changes how the shader is called! (See the shading pipeline docs, and the special shader parameters.)
Ergo, we must tailor the wrapper to (nearly) every shader we want to wrap. I used a Mako template to generate the shader code. This template is evaluated and the result compiled at render-time for each shader that is wrapped. (See the render script with the Ri Filter.)
As of writing, I am only wrapping the surface call, so this isn't actually necessary, but it will be as soon as one wants to use the variable parts of the pipeline as described in the docs above.
Statistics in Depth
Finally, time is spent rendering surfaces which aren't just the top most. Think of either translucent surfaces or volumes, in which the final colour is an integration of potentially thousands of samples.
RenderMan now supports deep compositing via a DTex file format. Instead of integrating all of the samples at various depths per pixel, it stores every one of them (at least until fully opaque). This allows us to retain all of the timing information and post-process it into a viewable form.
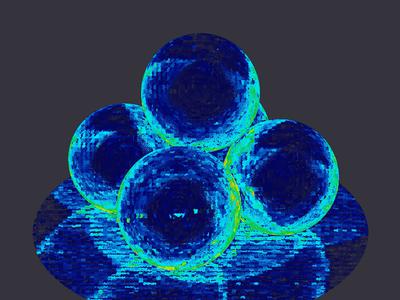
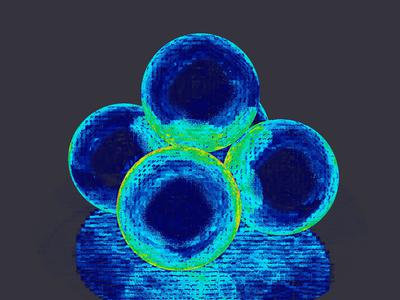
For this example, I decided to simply sum the timing contributions of all of the samples per pixel, so you can directly see how much time each pixel took. You can easily see this summing if we take the matte spheres above, and simply make them slightly translucent:
![]()
The timing differences are now primarily between the different overlaps of the spheres, and the most expensive pixels are where 4 surfaces overlap.
You can see the tool which sums the timing contributions and creates the stereotypical heatmap colours.
Caveats
There is still a lot of work to do in order to get a perfect wrapping of arbitrary shaders, including:
- expose all AOVs of the wrapped shader;
- expose all public attributes of the wrapped shader (for message passing in RSL);
- expose all shader pipeline methods of the wrapped shader; and
- expose all special shader parameters of the wrapped shader.
Finally, the Dtex format is not perfect for this use. It is only accurate until you reach 100% opacity, and there is often geometry which is rendered even though it will be obscured by other geometry. These contributions to timing may not show up accurately.
I had considered writing a point cloud of the stats instead (and rasterizing it from the camera's perspective). The tricky part is that the renderer shades multiple points at once, and so the timing information is across that entire block, while the built-in point cloud shadeops would write a point per shading point introducing redundant data that would need to be cleaned up.
Results and Raised Questions
I also played with the aachrome and aaglass shaders (respectively):
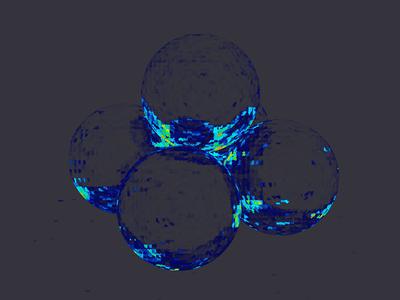
By far, the most puzzling aspect of these results to me is actually in the scene at the very top in which there are ray-traced shadows on matte spheres. In particular, why do the outlines of the shadows appear to take more time? My guess is that it is performing sphere intersections for both sides of the sphere when the edge is approached, but I don't have much to back that up.
Take a look at the GitHub repo to see how it all goes together.